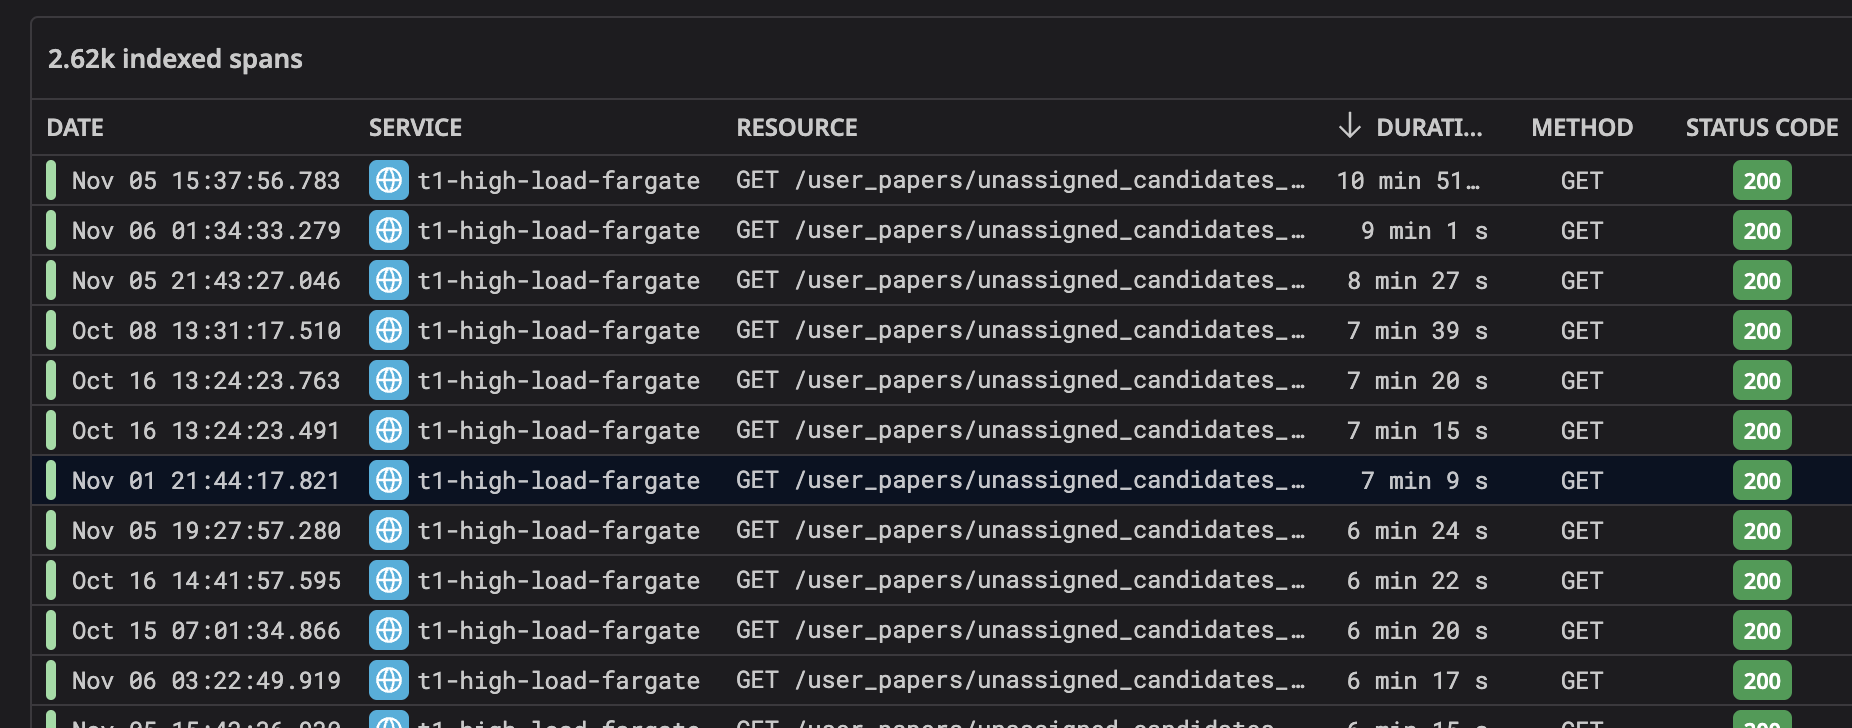
{: .box-success} Recently, we noticed some of our API calls were slowing down, especially as our data set kept growing. In the worst-case scenarios, response times were climbing to over 7.5 minutes! Knowing this wasn’t sustainable, we decided to dig in and optimize, even if getting it down to our standard target of under 3 seconds seemed like a long shot.
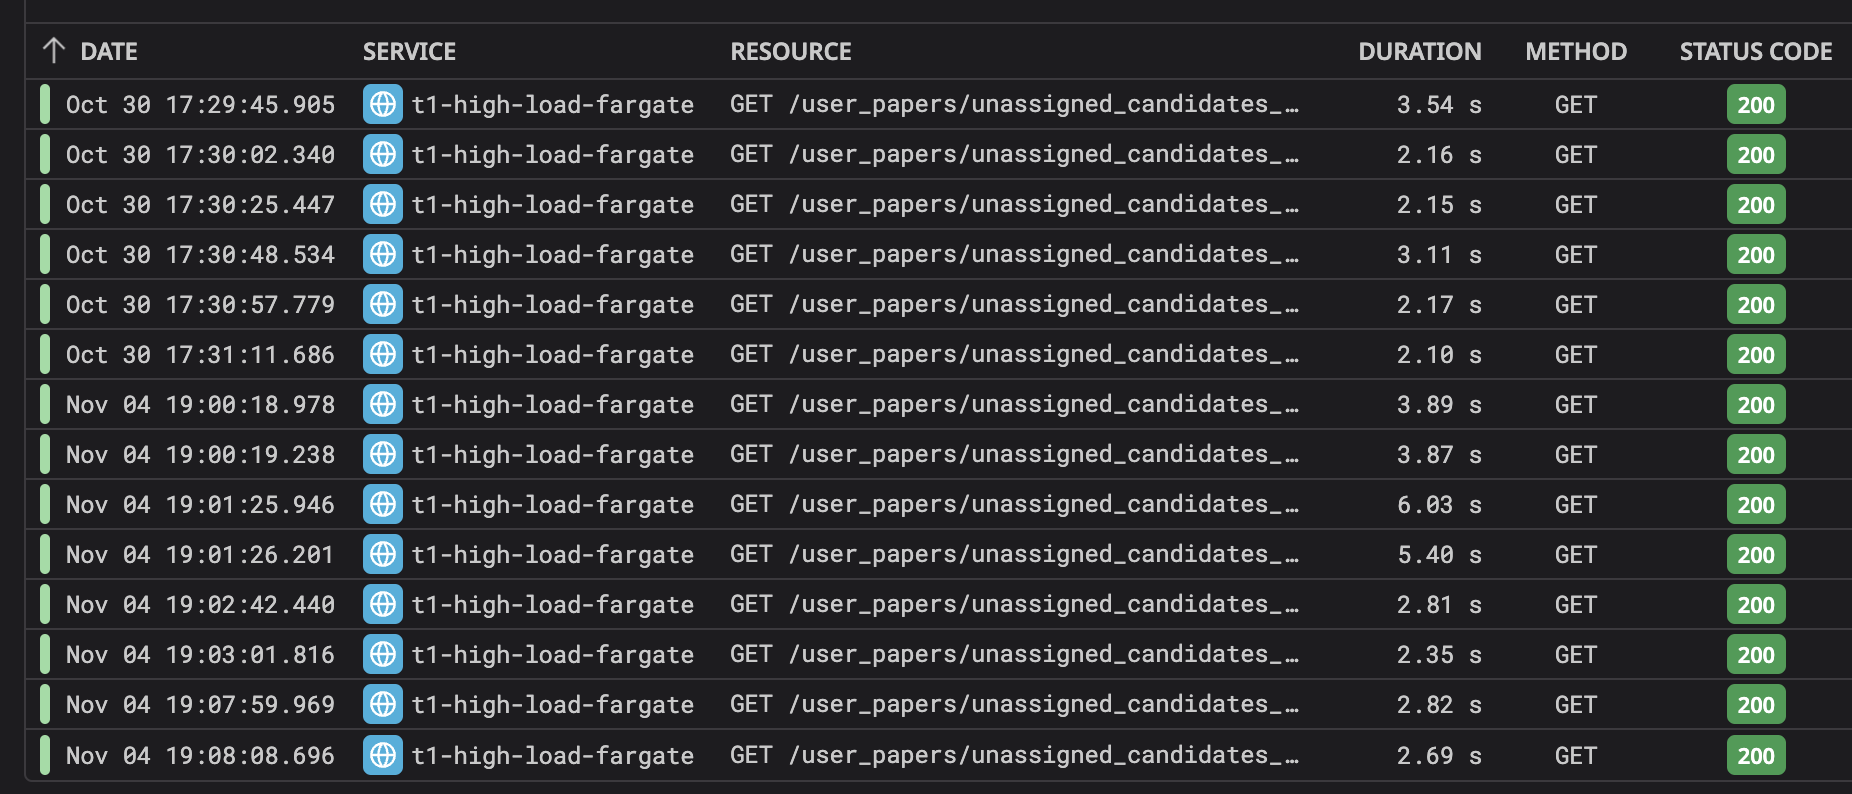
After some trial and error, I ran a test on the same data set following several optimizations. The result? The response time had dropped to just under 3 seconds—even in the worst cases. Here’s a breakdown of how we did it.
Steps I Took to Optimize the Queries
Once I was assigned to tackle the issue, I began by investigating the specific queries that were taking too long. Here’s the process I followed:
Checked Indexes
First, I looked to see if the collections were using the right indexes, as this is often an easy win. To my surprise, everything was indexed correctly. But, if the indexes were fine, could I still realistically bring down the response time to under 3 seconds? At this point, I wasn’t optimistic.
Ran the Query Planner
To confirm, I ran the query planner and found that it was indeed leveraging the correct indexes. This indicated that most of the delay was coming from network time, not from inefficient indexing.
Analyzed Document Load
Next, I considered the number of documents the query was returning. In worst-case scenarios, this was substantial, making it hard to achieve fast response times without changing the underlying business logic. Reducing the document load would require significant refactoring, which wasn’t a feasible option in this case.
With these factors in mind, I realized my main leverage was in reducing network time.
The Optimizations I Applied
I decided to revisit the query itself and see if I could streamline it. Here’s what I changed:
Removed Unnecessary Fields
One of the quickest wins was stripping out fields that weren’t strictly needed. Reducing the payload not only lowered the network load but also helped the query execute faster.
Refactored Queries
I reworked a few select queries, converting them to aggregations. This allowed the server to handle more processing internally and return only the essential data.
The outcome? Surprisingly, the improvements were dramatic.
Additional Options We Considered Another potential optimization was to place both the database and server within the same availability zone to cut down on latency. However, that would be a much bigger decision, as it impacts infrastructure costs, architecture, and more. For now, we decided to save this as a future possibility if needed.
Here’s a snapshot of the API response times before and after our changes:
API Response Times Before Optimization:

API Response Times After Optimization:

As you can see, we successfully hit our target of under 3 seconds.
Key Takeaways
Here are a few lessons from this experience that might help you with similar issues:
Don’t Underestimate the Power of Selecting Only the Required Fields By returning only what’s needed, you save time and resources. It’s a simple yet effective way to improve performance.
Aggregation Can Be More Efficient than Select Queries Select queries are often our go-to, but in some cases, aggregations are better suited for pulling minimal data with more control over processing.
This experience was a great reminder that even small adjustments can make a big difference in performance.